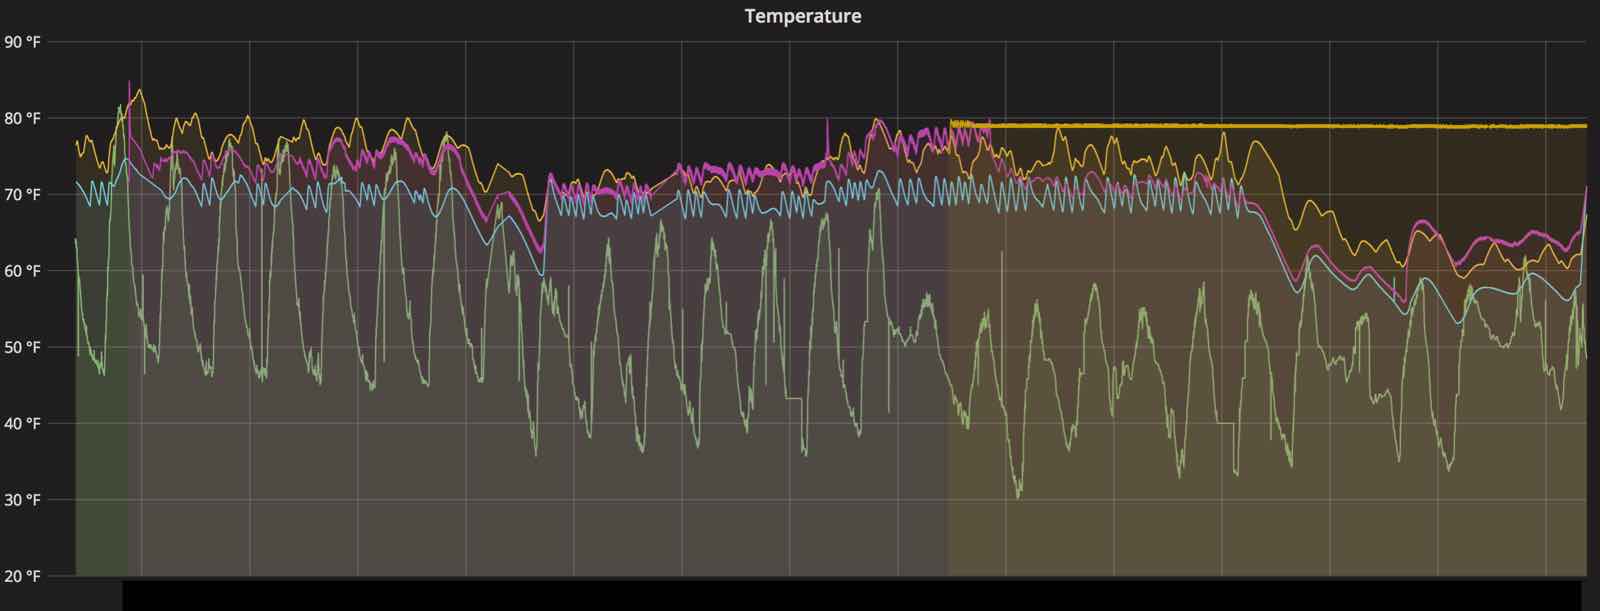
One goal for this year is to reduce expenses and one way is through using less energy. I know the heater consumes a lot of energy: 300w of electricity to run the blower fan, and gas to run the furnace. It could run it less often if I’m not at home.
Besides reducing energy use, I want to improve the comfort of the living areas and measure it. Certain rooms that I’m in often are up to 10 degrees hotter than others. Those need less heat.
Earlier 2017, I funded a kickstarter for Ruuvi. Ruuvi is a BLE (Bluetooth Low Energy) beacon that periodically transmits temperature and humidity measurements. The sensors are all inside the house at this point.
I spread these sensors throughout the house in various rooms. Right now, I’m limited by what parts are in Bluetooth range of a Raspberry Pi collector running in one room of the house.
Including the data collected from Ruuvi sensors, I collect temperature and energy data from other sources:
-
Weather Underground temperature from a neighbor’s personal weather station a couple houses away using Weather Underground’s API
-
Current temperature and thermostat settings of a Nest thermostat in the hallway using the Nest API
-
Ruuvi collector measurements from office, daughter’s bedroom, master bedroom, living room, garage, refrigerator and freezer
-
Whole house electricity usage and spot pricing from PG&E Smart Meter via RainForest’s Eagle Gateway Zigbee collector over a local HTTP API.
Unfortunately the smart meter used for PG&E’s gas line doesn’t allow consumers to track gas usage. Gas usage is at least 40% of my cost.
The RainForest Eagle can read out the spot pricing. As you can see, when my total usage in a billing period goes above a baseline tier, the price per kW/h jumps unti the billing cycle reset. Also, during the peak periods of 5pm to 8pm, the spot price increases.
The script also logs the current energy use multiplied by spot price per kW/h once a minute to estimate the energy cost. Since it’s hard to see the monthly effects of minute by minute detail, I summarize this on a longer period (2 to 4 weeks) graph of monthly cost based on usage in the time period so far. In the above graph, it would be $85/month if the usage pattern continues.
Actions taken to reduce cost
I adjust the thermostat down when I plan to be away and increase it a few hours before I plan to return. You can see that by the extended periods of even lower usage in the second half of the graph. I couldn’t use Nest’s schedule feature because it is only on a weekly basis. The UI requires much interaction to adjust schedules. Instead, a script driven off a table of dates adjusts the temperature automatically.
Now the temperature in the whole house can drop to 50 degrees while the tropical fish tank stays at 79 degrees because of an earlier project.
Actions taken to improve comfort
I completely shut the furnace vents in the two warmest rooms of house. As the furnace runs and heats the rest of the house, these two rooms get minimal additional heating.
After noticing the temperature in one of the rooms was getting colder than I wanted, I cracked the vent open again a tiny bit. I imagine this is what HVAC technicians do when they come around and adjust vents to even out hot and cold spots in an office building.
Learnings
-
When the heater was not running at all (right-most fourth of the graph), even though the outside temperature regularly dropped to freezing temperatures at night grazing against 33 degrees (bottom most line of graph) — thanks climate change :( – the interior of the south facing rooms (magenta and yellow fluctuating lines) never dropped below 56. It could be that heat from the sun radiated through the windows and was captured – even though the shades were drawn.
-
The living room (blue line) dropped in temperature more since it doesn’t get much direct sunlight.
-
The top flat yellow line (aquarium heater) was unaffected as I expected.
Future actions to consider
-
I could adjust my freezer and refrigerator temperatures up a bit more to reduce refrigerator cost and still maintain food safety. I don’t yet know the energy cost of running the refrigerator. The refrigerator is maintained at 32 degrees Fahrenheit and the freezer stays about -10 degrees Fahrenheit.
-
I could target improvement of insulation for rooms where the temperature drops lower compared to the rest of house. This would allow those rooms to be more comfortable at a given level of heating and drop less in temperature requiring less heating.
-
Add more Raspberry Pi BLE collectors in other parts of house to get signal more reliably from sensors. There is already one serving as an aquarium heater controller. I plan to deploy a second one as a collector and an energy display in another part of the house.
Source at github.com/clarsen/home-energy-monitor


